Engineering Student | Software Developer
Find Out MoreThrough a diverse range of work experiences, club and design team involvement, and participation in multiple competitive team sports growing up, I have developed a powerful perspective on the impact a dedicated, cohesive team can have. As I continue to expand my skillset and familiarity with some of the new advancements at the forefront of the tech industry, I am excited to find meaningful projects with people who share my interest and enthusiasm in making an impact, and affecting positive change in our communities.
I am currently a fifth-year Engineering Physics student at The University of British Columbia in Vancouver, BC. I am working towards a specialization in computer science, and a minor in statistics, and I expect to graduate in April, 2022. Feel free to reach out to me at any time, I would love to chat about some of the awesome projects and teams I have been (or am still) a part of!
A PDF of my current resume can be found at the following link.
Ben Huckell - Resume 2021UBC Rocket
The Base 11 Space Challenge is an initiative which offers the first university student rocketry team a $1 million prize to design, construct, and ultimately launch a single-stage, liquid-fueled rocket to an altitude of 100 km (Karman Line) - the edge of space. The following video from the Base 11 website further explains the competition, and the initiative as a whole. The Whistler-Blackcomb subteam of UBC Rocket is undertaking this challenge, and we hope to launch in December, 2020.
In order to properly quantify the performance of our various engine iterations, we needed to build a dedicated engine testing stand capable of delivering the necessary fuel and oxidizer, and handling the thrust from the combustion reaction.
As a part of the Whistler-Blackcomb subteam, the first project I was involved with was the integration of an HMI, PLC, various pneumatic actuators, and several temperature and pressure sensors with this engine test stand. We used a Productivity Suite P-2000 PLC to control all logic and operations associated with the engine firing process. This involved using ladder logic to input all necessary sensor readings, execute all operational procedures, and log all measurements of interest for future observation. On the HMI side, we used Indusoft web studio to create a functional, yet organized HMI capable of displaying all sensor readings and executing test stand operations.
The following video captures a 1 second hot fire test of our second generation engine. On the left side of the video, the remotely-operated test stand can be seen before ignition.
Since, we are dealing with high pressure gases, and a combustion reaction that produces large amounts of heat and significant thrust forces, safety must be a primary consideration. All implemented ladder logic includes safeguards to ensure that the operation is running within the modelled thresholds, and emergency stop capabilites should anything go wrong.
When our rocket eventually launches (hopefully in December, 2020), the onboard avionics system must be in constant communcation with all on-board sensors to relay flight status and execute mission-critical operations. This capability is vital to successfully reach an altitude of 100 km and return the rocket safely back to earth through the deployment of the recovery system.
The rocket avionics system must be able to perform all necessary safety checks in the process of fueling, ignition, and eventually flight. Through its flight, the system must constantly monitor its GPS location, acceleration, and altitude. Our GPS and accelerometer units will eventually act as the primary data collection hardware. Location and acceleration values are taken straight from the readings we recieve from these devices.
I was responsible for building a robust, object-oriented state machine capable of keeping track of our rocket's status before and after launch. I implemented this solution in C++, where each state represents a critical phase of the launch and recovery sequence. Our prelimiary state diagram, including state transition criteria and state actions are shown in the diagram below.
For low-flying rockets that stay well within the bounds of Earth's atmosphere, a differential pressure sensor can be directly used to calculate our altitude via the application of the Barometric formula. However, with a rocket that is being sent to space, the atmosphere is so thin at higher altitudes, that this method of calculating altitude is far too unreliable.
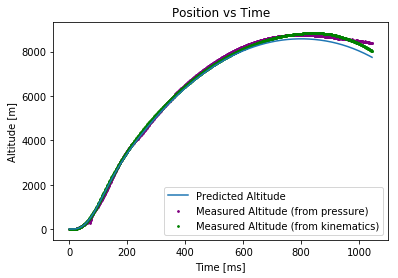
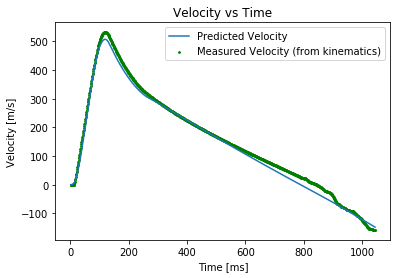
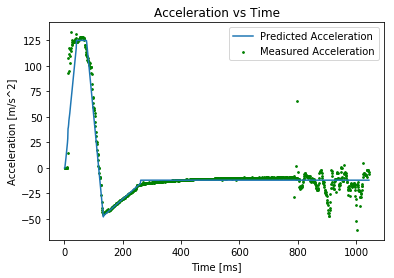
Correctly measuring the altitude of our rocket in-flight is vital to the deployment of our recovery system after we have reached our target apogee. Since we cannot directly measure pressure, we must use the kinematics of the flight path, augmented with a Kalman filter to accurately predict and measure where we are in our flight path. We are still in the process of verifying our algorithm's functionality, and testing its implementation throughly. Below are the results we have obtained thus far, using data gathered from our last 30,000 ft rocket "Sky Pilot" which launched this past year at the IREC Competition in New Mexico.
Designing, building, programming an autonomous robot to navigate a course in the annual Engineering Physics Robot Competition
The annual UBC Engineering Physics Robot Competition gives students the opportunity to build an autonomous robot from scratch. Each year a different theme or backstory characterizes the ultimate goal of the robots that are competiting.
The 2019 Robot Competition featured an Avengers theme - robots had to navigate the course head to head against another robot, while trying to collect both infinity stones and avengers and return them safely to their side of the playing surface. The following UBC article further explains some of the backstory and competition context.
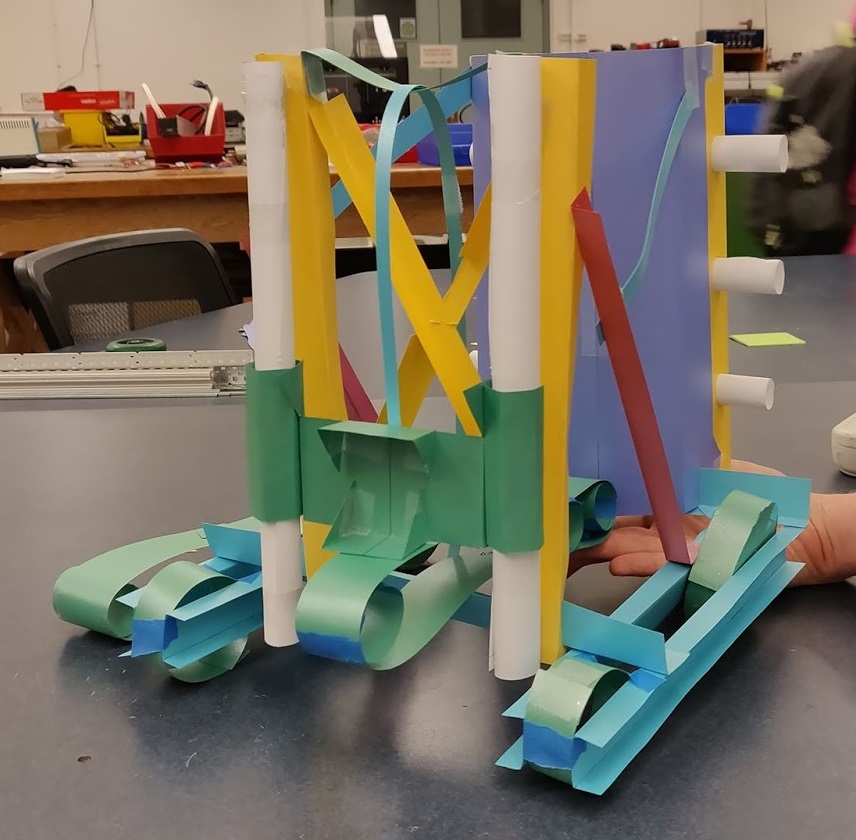
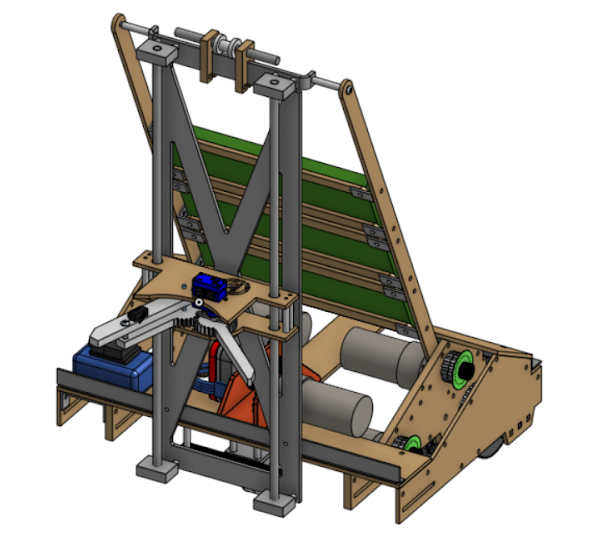
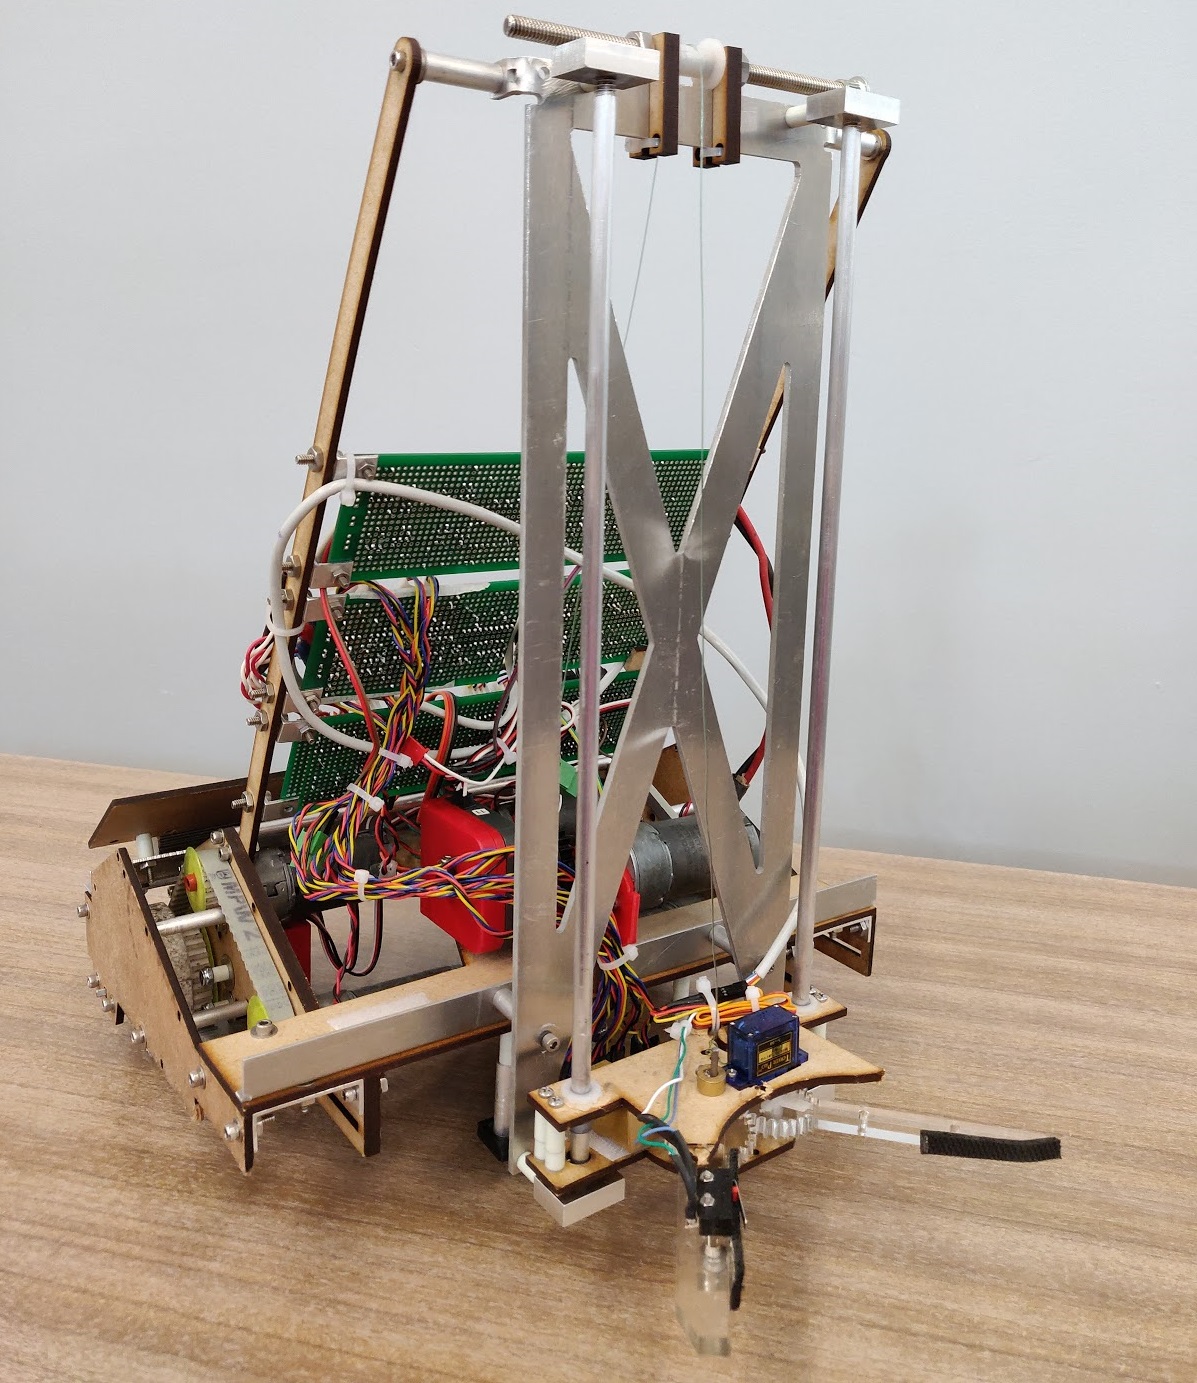
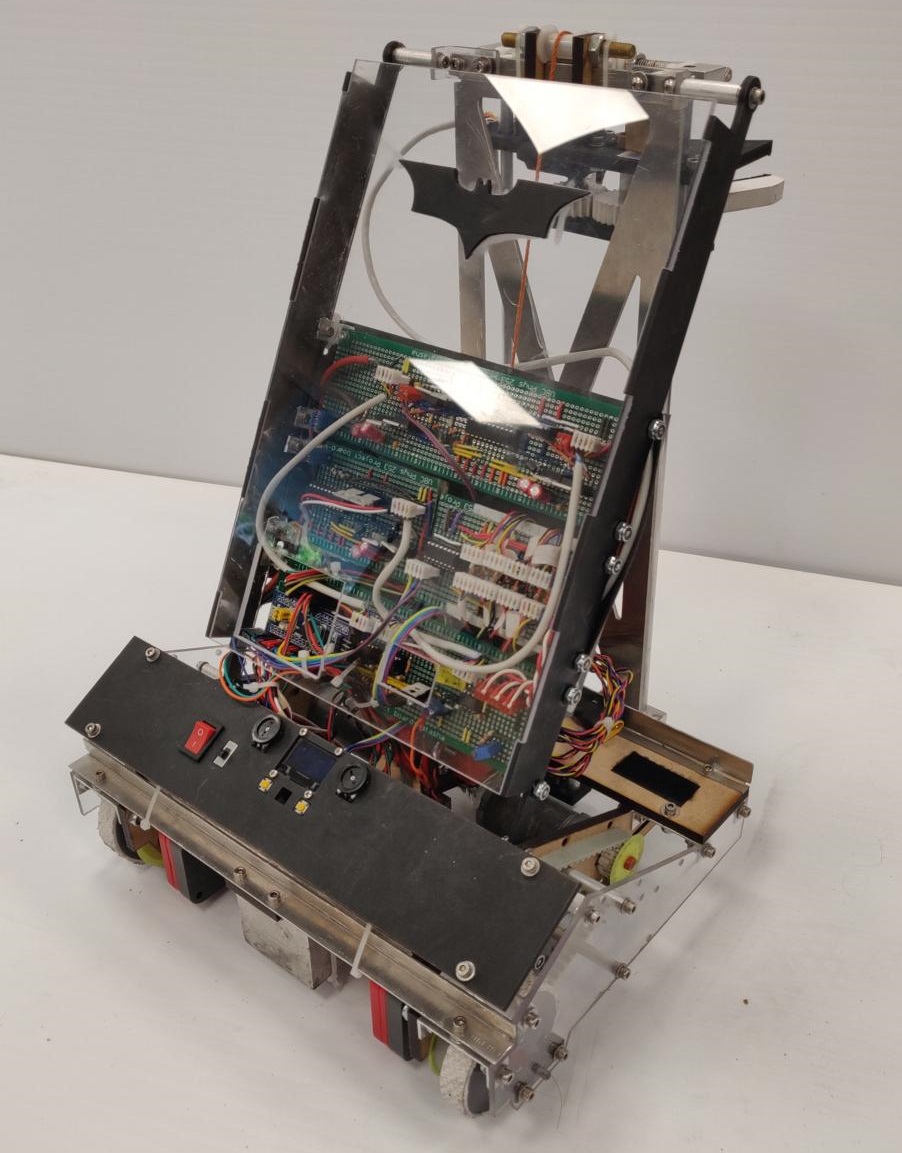
UBC Engineering - Saving avengers at the 19th annual engineering physics robot competitionOne of the most fun projects I have been a part of, we worked in groups of four to tackle this years challenge. To construct the actual physical robot, we used the OnShape CAD platform to design all parts, and the assembly as a whole. We then used various methods to prototype and eventually build our chasse including the use of hand tools, laser cutter, and waterjet cutter. Below, you can see our first prototype, our final CAD model, and ultimately the robot we built!
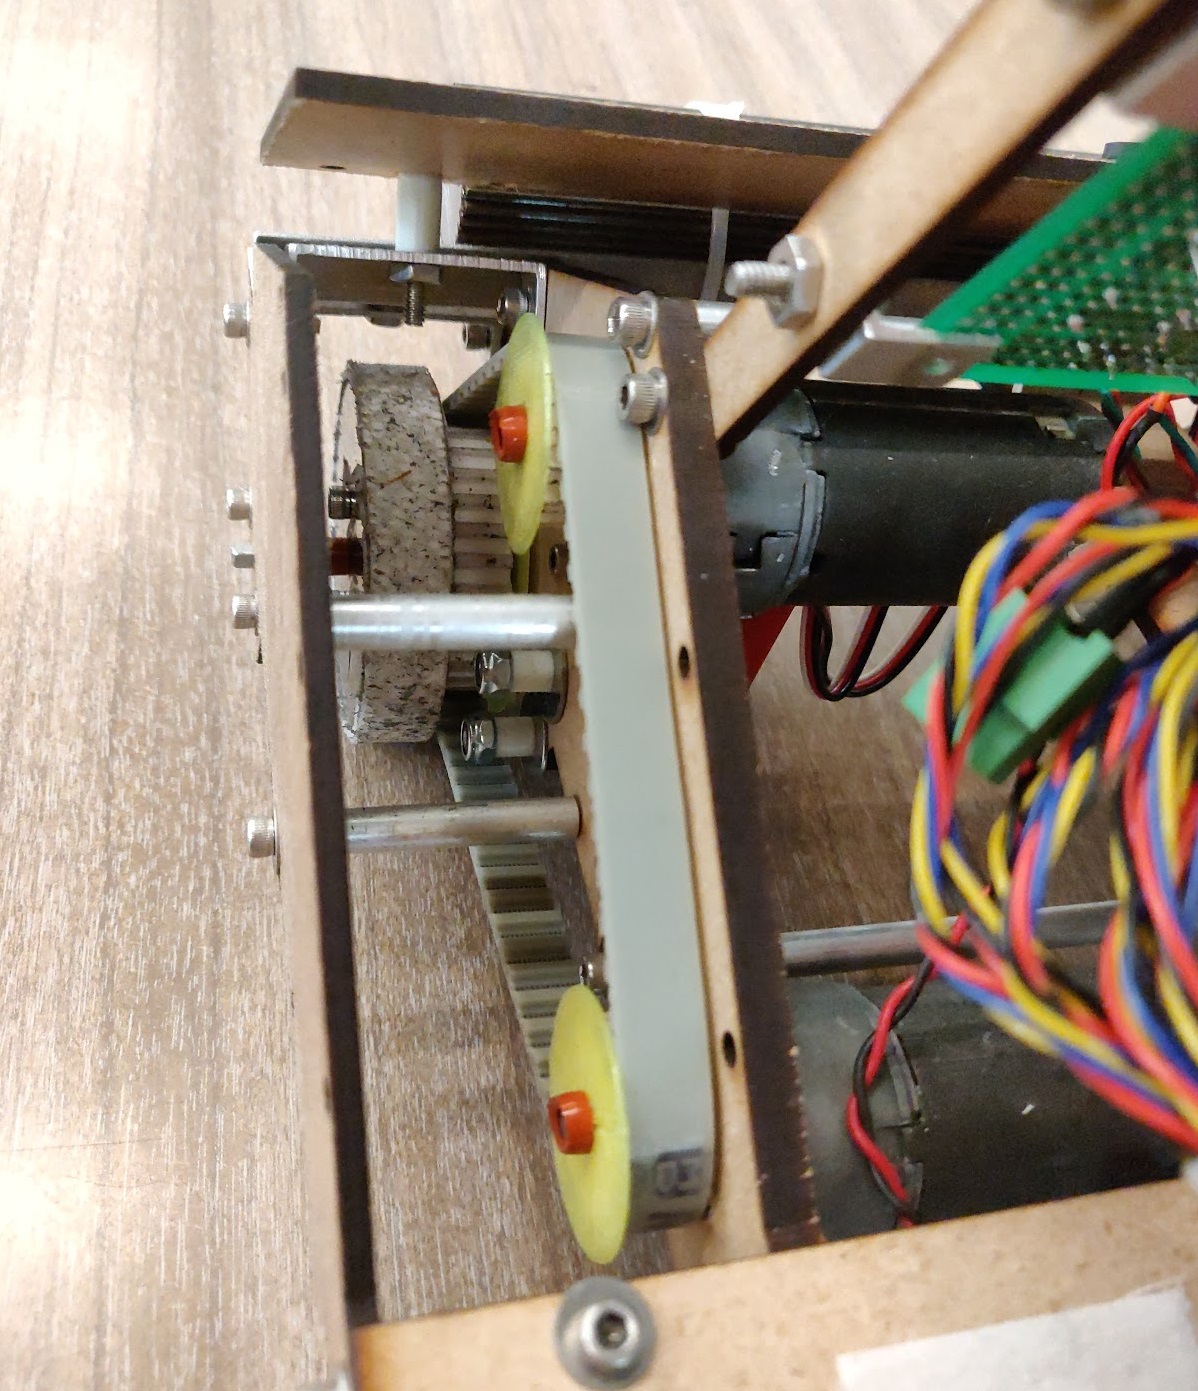
We chose to use a timing belt to supply each wheel with power from two motors, geared using a 2:1 ratio. We chose this design to maximize the speed we were able to travel at, while still meeting our basic torque requirements to travel up inclined surfaces.
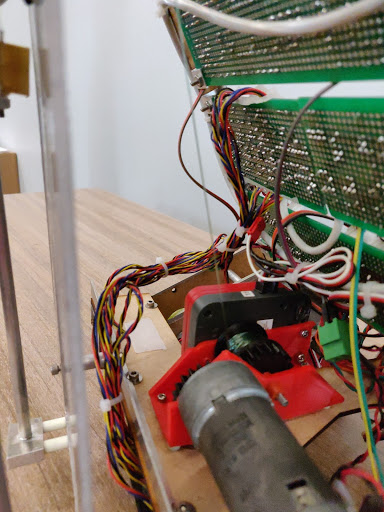
To make our microcontroller, H-Bridges, and QRD 1114 light sensor array circuitry accessible, we designed a crossbar to allow for easy debugging. With this design, all electrical components were easily seen and accessed, and the downtime due to any major electrical changes was minimized. The crossbar also assisted in reinforcing the linear slide structure which guided the claw carriage.
Our main strategy relied on picking up the infinity stones from their platforms. This required our claw to be able to hold onto the collected stones until we have reached our home area, then release the stones into their respective holes. We used a small servo motor connected to two meshing gears with 5 inch arms to complete this task.
To raise and lower our claw carriage to match the appropriate height of the infinity stones, we used a winch or spool mechanism. To raise the claw we would simply spin the winch motor which would wrap the string about the spool, providing a tension force parallel to the supporting rails.
We designed an object-oriented state machine to control our main program flow. Each state represented a distinct task that the robot was required to complete. For example, we had one "Line Following" state which simply kept our robot centered on a continuous strip of black tape, using input data collected from our QRD Light sensor array. The following video shows one of our practice runs, where we were able to successfully collect three infinity stones.
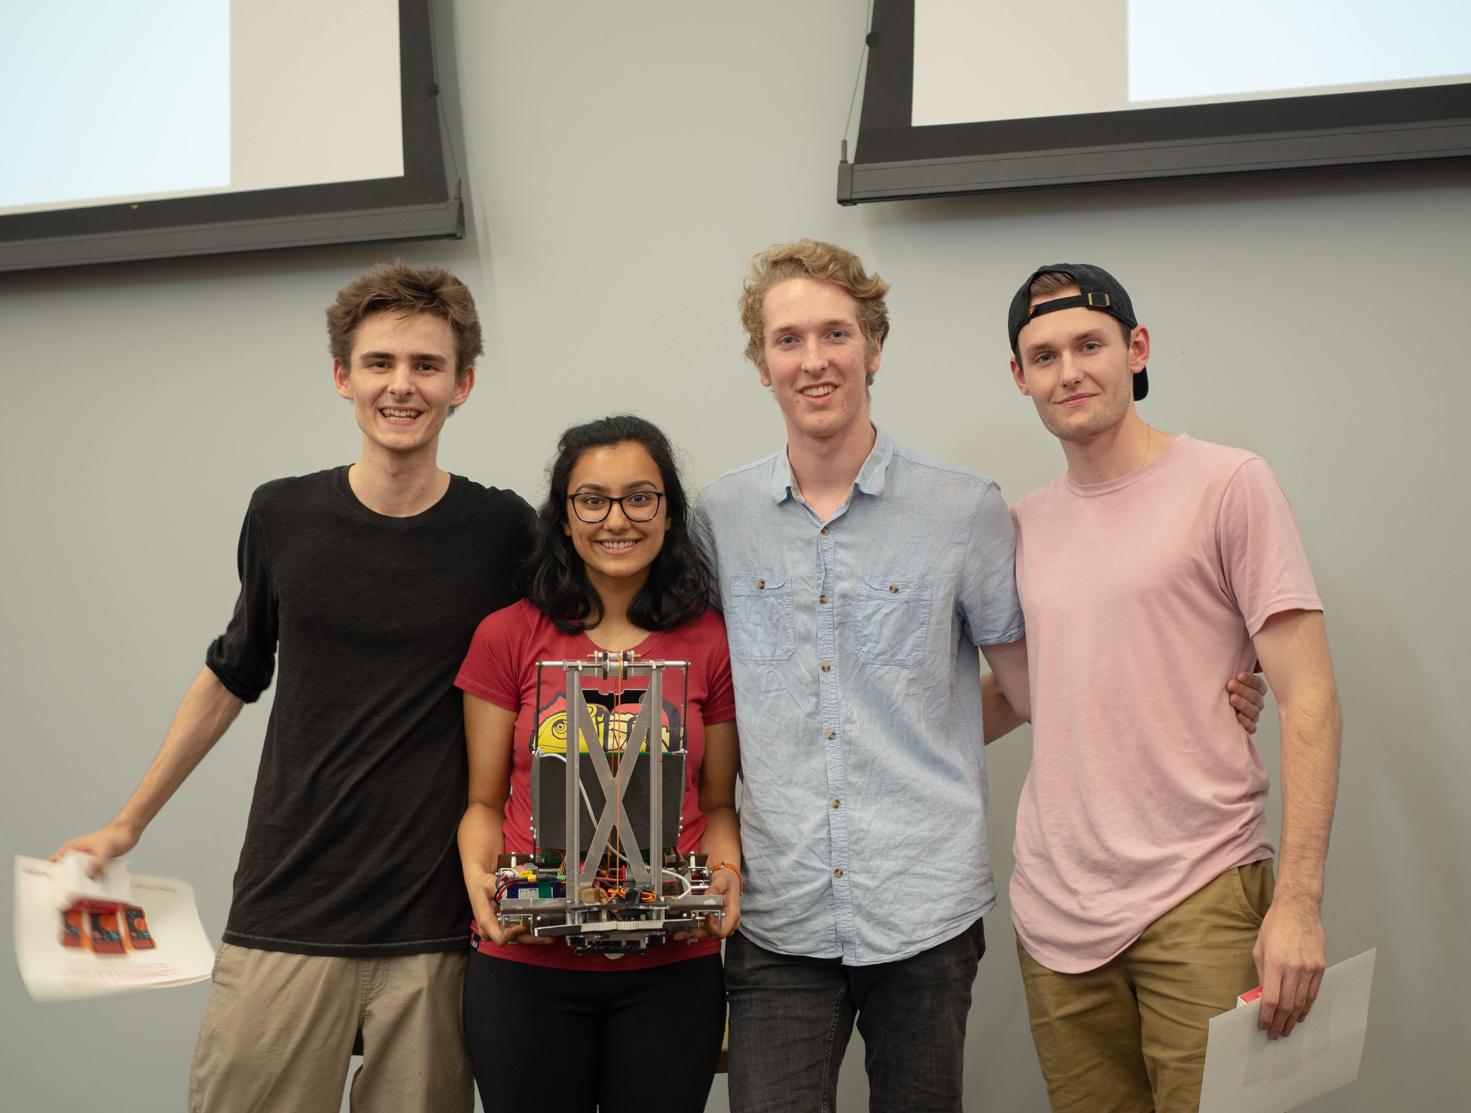
After months of hard work, our team was fortunate enough to come first place the 2019 UBC Engineering Physics robot competition! The pictures below are the team (Josh White, Kritika Joshi, Josh Zindler, and me), shortly after receiving our first place prizes, and our final competition-ready robot.
Navigating a simulated world with computer vision, capturing license plate images and processing with trained neural network
A brand new course added to Engineering Physics this year, ENPH 353 is a project based competition course where teams of two were challenged to program a robot capable of navigating a simulated world, avoiding obstacles, and collecting license plate information from various parked cars. Correctly labelling the location and license plate number of parked cars would yield points, whereas any off-road travel or collisions with world elements would deduct points.
For anyone so inclined, our full-length final report can be found using the following link, but a summary is provided below.
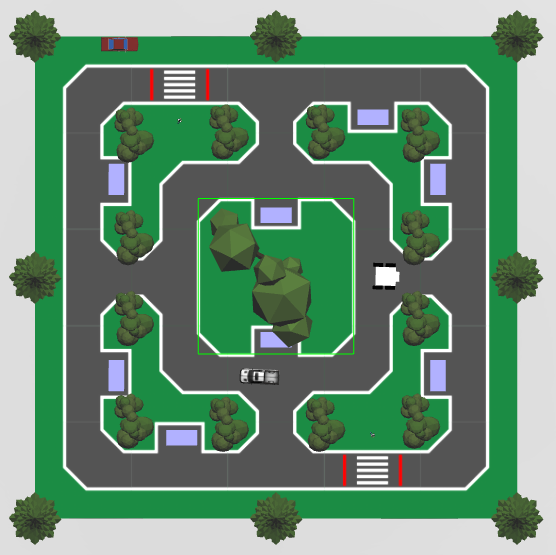
ENPH 353 Final ReportThe following image captures a top view of the gazebo simulation world that our robot operated in. Our robot (in white) is shown at its starting position on the road and the "parked cars" are represented by the blue rectangles placed throughout the course at various "parking locations". Our objective was to navigate the roads, and collect the license plate information of all parked cars along our path.
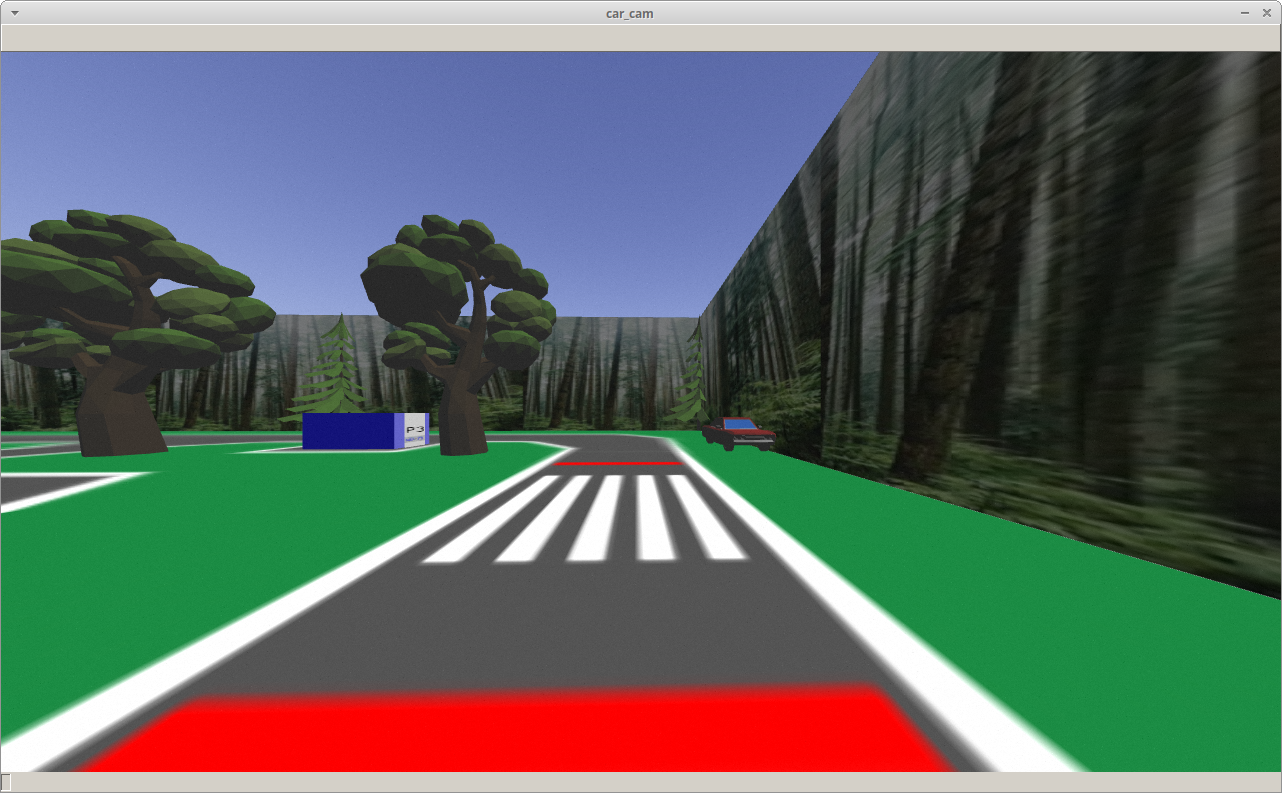
The operation of our robot relied solely on the camera input feed it received from the virtual world. Within the gazebo simulation, a camera mounted on the top of the robot facing forwards continuously fed our system with an image feed. The following image shows an example of the frame we would recive back.
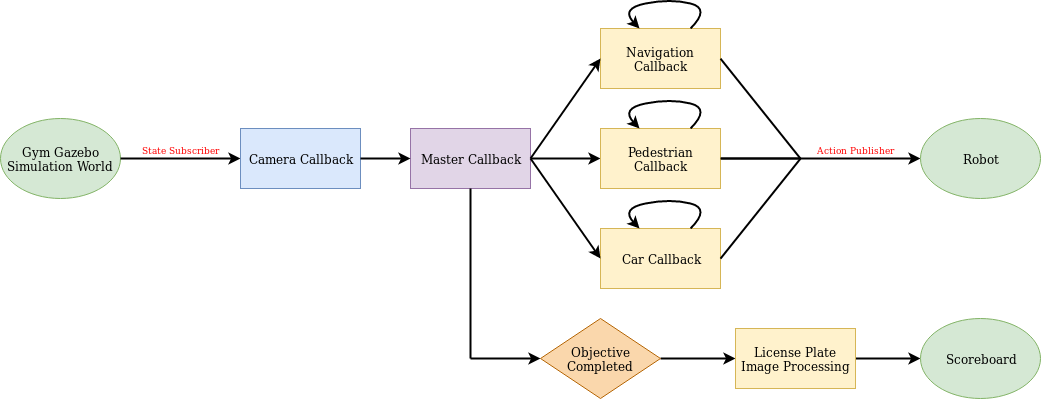
Since the only input to our system was the camera feed, our system needed to be capable of transforming an input image into output commands through a series of callbacks and algorthims. At a very high level, this architecture is summarized in the following diagram.
Each "callback" is essentially an asychronously running method responsible for handling a specific aspect of our robots operation. For example, our "Car Callback" handles capturing images of the parked cars, as well as avoiding the roaming truck which circles the middle track. Our "Navigation Callback" uses the camera feed to stay centered within the road, and to properly stop at crosswalks. After we have successfully navigated the course, our system has captured multiple images of each parked car we have passed.
After capturing images of all parked cars, an "Objective Completed" flag withing our system gets set True. This starts the execution of our License Plate Image Processing Callback.
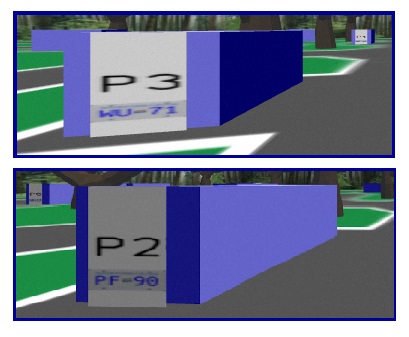
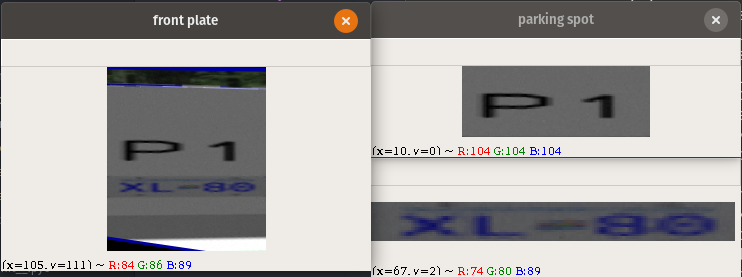
The captured images are first filtered and cropped to identify the portion of the image which has the parking location and plate number information. Below, the images show an example of the unfiltered captured images, followed by the process of locating the areas of the image which hold the information we are looking for. It is worth noting that some of the images we capture are not completely in focus. Regardles, our algorithm was able to correctly identify and crop the images for further processing. After filtering the images, we send them through our pre-trained neural network which outputs the parking location and licence plate number to the terminal and scoreboard with an accuracy of 98%.
The following video shows a captured demo run of our finished robot. A top down view on the right portion of the screen shows the robots progress through its path, whereas the left portion of the screen shows the world through the eyes of the robot. There are a few other key points worth noting below.
Within the gazebo simulation world, we had to deal with the constraint that output commands were discrete in nature, meaning there was only a finite set of commands that we could give. In our case, this meant that we could not publish "go forward" and "turn left" commands at the same time. The result is that our robot looks very jittery as it travels. Its worth noting that this is simply a limitation of the platform the simulation was running in.
Bounding boxes can be seen throughout the video. Parked cars are represented with blue bounding boxes, pedestrians with red (or green) depending on their position, and the roaming truck with a yellow bounding box. The identification of these objects of interest were what we used to make decisions within our code.
At the very end of the video, all captured license plates are printed to the terminal in the top left corner of the screen.
Determine a player's true value, looking past the numbers
Participating in a fantasy baseball league is an annual tradition amongst my friends. However, year after year I began to notice that I was picking specific players either because I recognized their name and liked them, or some "fantasy expert" said they would have a great year. In either case, I was not making a well-informed or justified selection. There had to be a way to reduce the countless numbers and expert recommendations into one meaningful number.
To make well informed decisions, I needed to reduce all of the projected statistics into one single number. But the tricky part was comparing metrics that are so fundamentally different. How would one compare stolen bases to strikeouts? Walks to home runs? Lets look at an example with two different hypothetical players, with their Home Run and Batting Average projections for the following year.
If we consider a hypothetical league that only considers Home Runs to score points, it would be very easy to determine the better choice. Player A is likely to get more Home Runs than Player B - therefore I would choose Player A. However, if we were to introduce a league where both Home Runs and Batting Average were included, it becomes much less clear who the better choice is. This is where the concept of a Z-Score comes in.
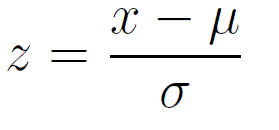
A Z-Score is a common statistical variable which measures the number of standard deviations a number is away from the mean of a data set. This allows players to be compared, in each category, to the other players in the league. By measuring the number of standard deviations a number is from the mean of all players in the league, we can directly compare Home Runs to Batting Average and, by extension, Player A to Player B. The following is the Z-Score formula.
Once we are able to directly compare a player's performance to all other players, category by category, we can then sum each players individual Z-Scores from each category, to get one "overall" Z-Score. This is exactly how I am able to convert multiple numbers across many different categories, into one, meaningful number.
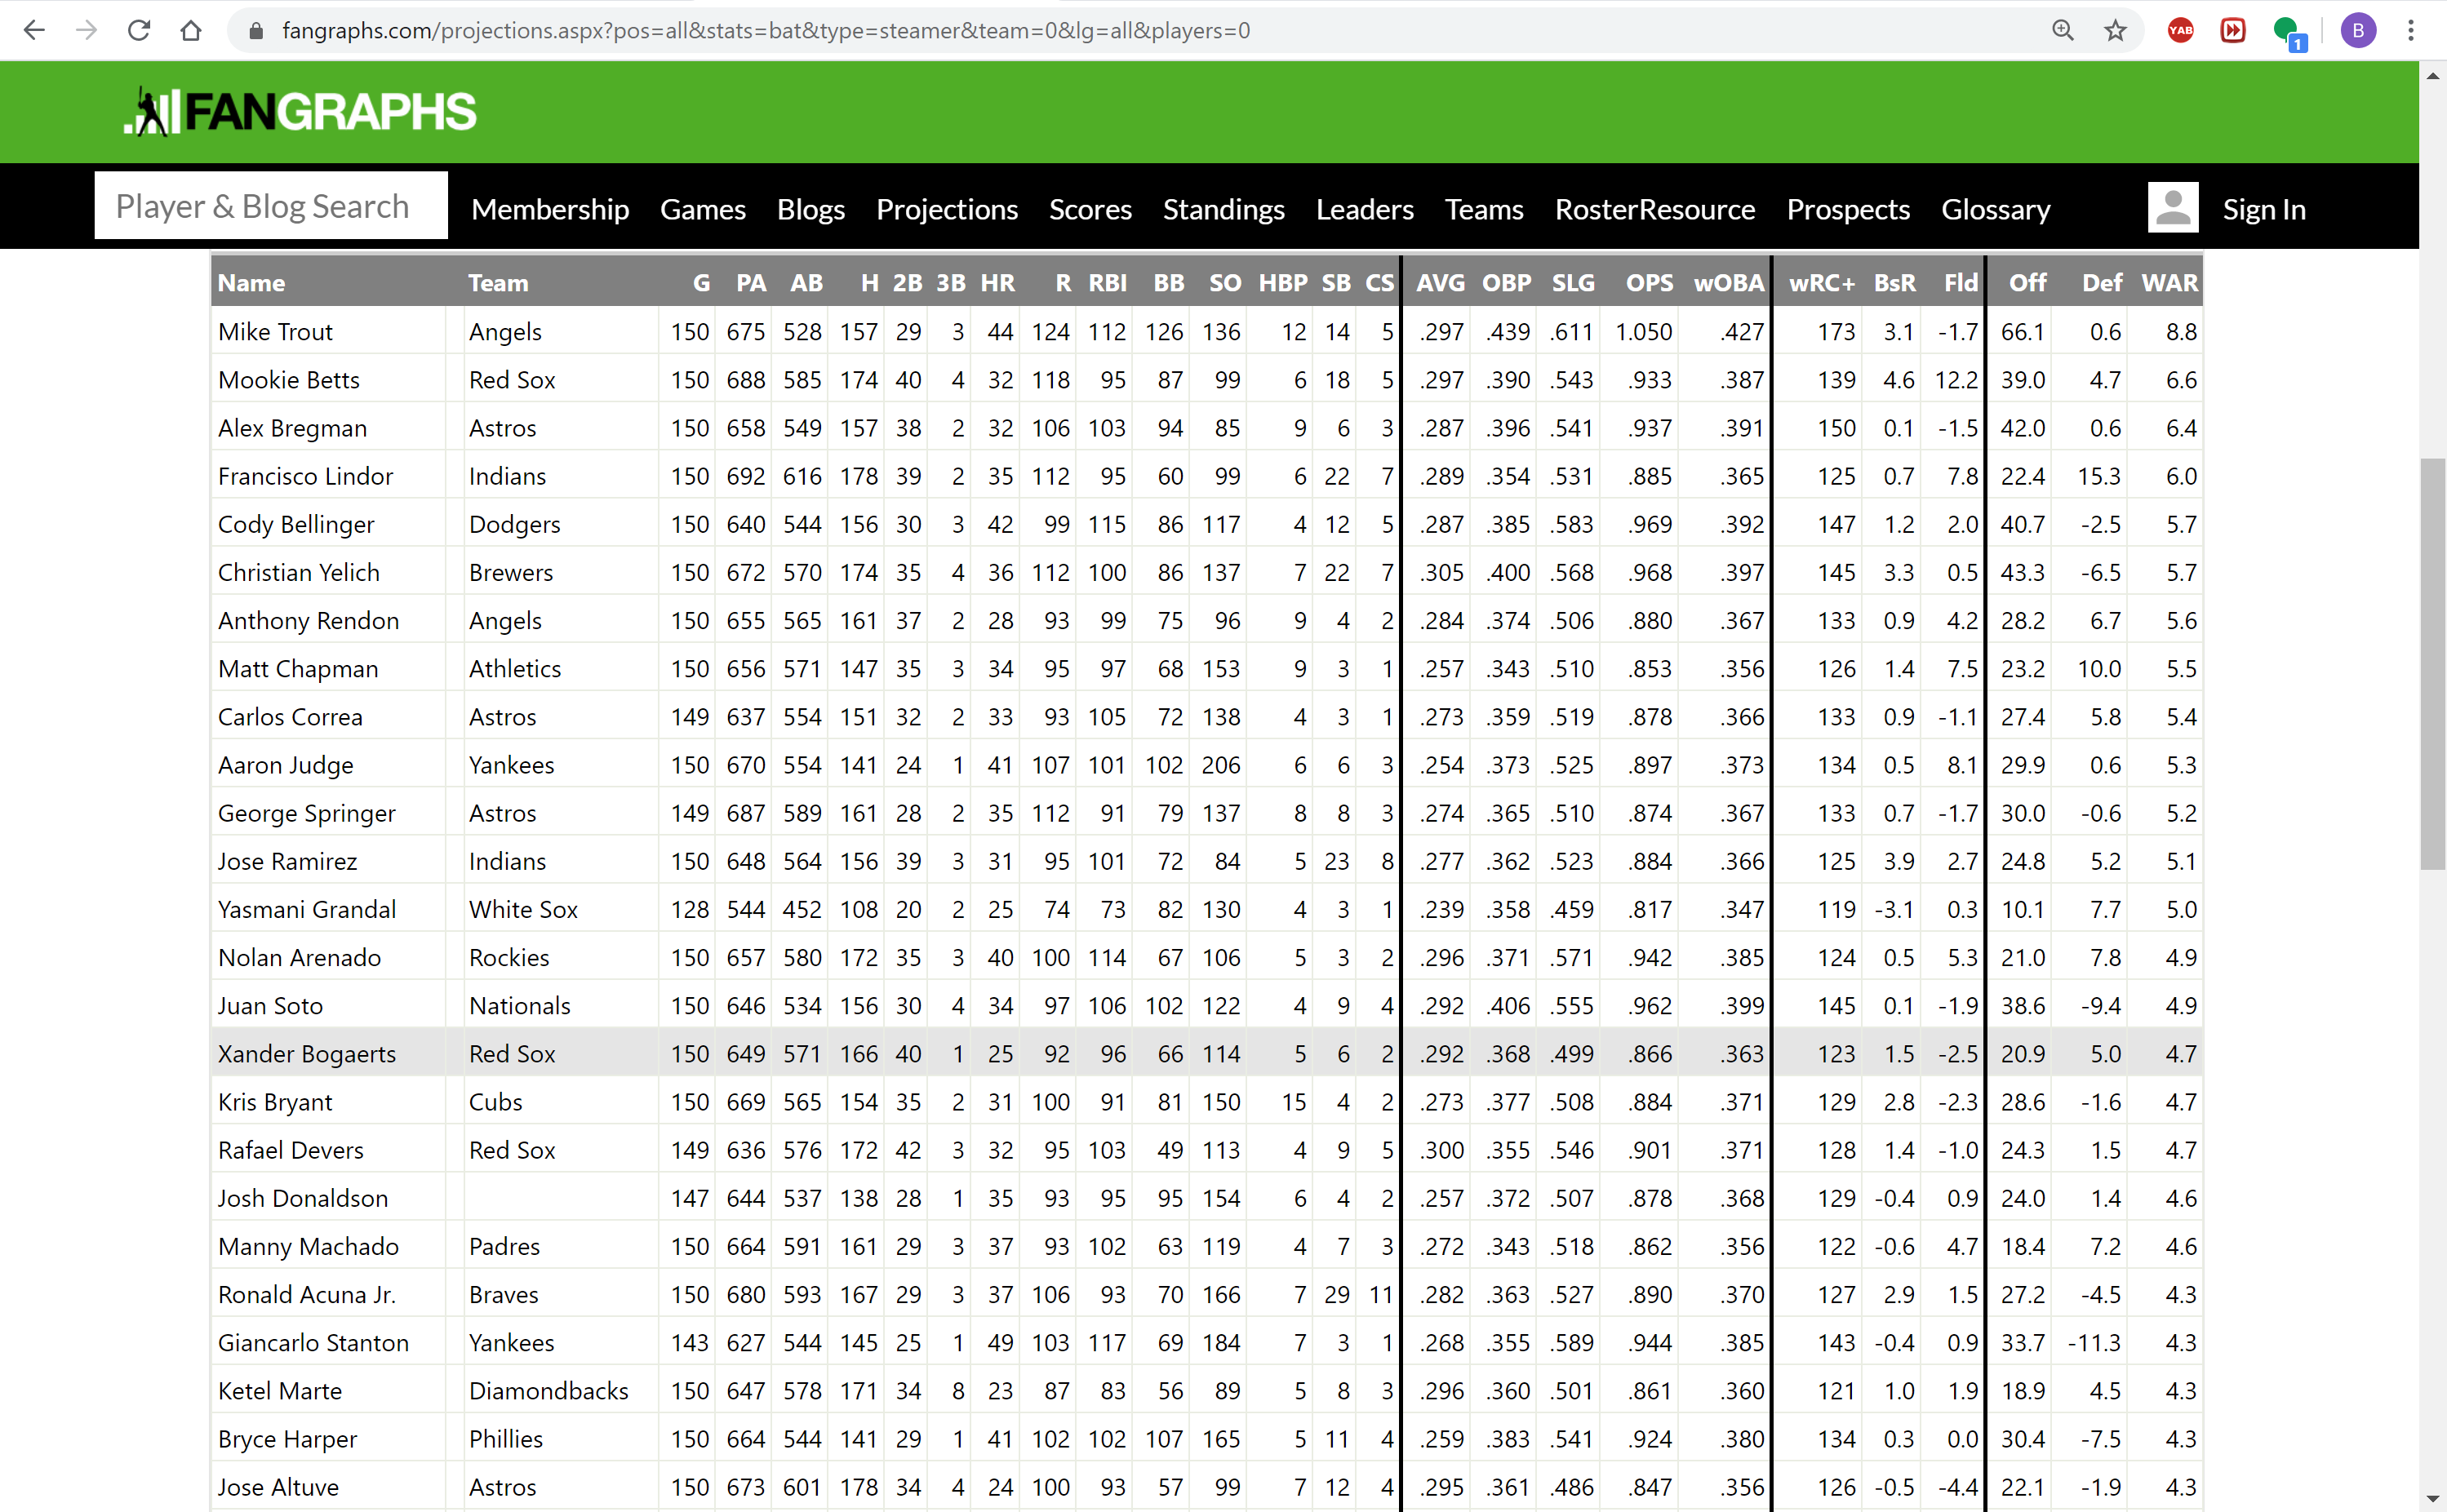
There are countless websites which offer free player projections, organized by category. For my projections, I used Python's BeautifulSoup library to scrape fangraphs.com for its "Steamer" fantasy baseball projections. Once I gathered all the data for each player, I saved the content into a Microsoft SQL server for easy table manipulation later on. The following images show the Steamer projections, as well as the saved table within Microsoft SQL. Saving all of the information here made the data very easily accessible from the Visual C# program I used to calculated performance estimates.
Now that I have gathered all of the statistics I need, the only remaining problem was ensuring that my main program worked for a variety of fantasy league formats. Some fantasy leagues are points-based, some are rotisserie-based, each includes different required positions to fill, and many determine winners based on custom-selected categories. The program needed to include some functionality for the user to define the specifications of their league, and the calculated Z-Score would be specific to their setup.
To make sure that my program was robust enough to handle a variety of possible fantasy baseball leagues, all parameters involved in the Z-Score calculation are based on the league parameters that the user enters. The User Interface of this league selection screen is shown in the image. Users can name their league, set their roster composition, and determine which metrics are used to calculate points, including the relative weight of each metric involved. This is done for both hitters and pitchers.
The following table is custom generated for each set of parameters defined by the user. It reduces all of the available player statistics and projections into one number (the "Score"). Taking personal bias out of the equation, players are compared simply in reference to each other, and ranks are clear.
For the past three years, I have tasked this program with selecting my teams in my annual fantasy league. Simply basing my player picks on their overall Z-Score, I have won twice, and finished in second place once.